The ceiling came down.
The top tax rate was 91 percent through the Eisenhower boom. Today it is 37. That is not an accident of history — it is a seventy-year project, pursued by both parties, sold every time as the key to growth. Here is what it actually bought, and who it bought it for.
This is the long history behind The Interest Trap. We grade it carefully, because the numbers are abused by both sides: the right pretends the 91 percent rate was a job-killing fantasy no one survived, and the left pretends the rich actually handed over 91 cents on the dollar. Neither is true. The honest version is more useful than either.
What this page is about
The highest marginal federal income-tax rate peaked at 94 percent in 1944, sat at 91 percent through the Eisenhower years, and has been cut, step by step, to 37 percent today. That decline is the documented backbone of this page, and it was bipartisan: the first big cut came from Kennedy and Johnson in 1964, the deepest from Reagan in the 1980s. Every major cut was sold with the same promise — that lower rates at the top would unleash so much growth they would pay for themselves.
Two honest fences keep this from becoming a fairy tale in either direction. First, almost no one ever paid 91 percent: that rate applied only to income above a very high threshold, and deductions and shelters were everywhere, so the rich paid far less than the headline — materially more than today, but not 91 percent. Second, federal revenue has stayed close to 17 percent of GDP through every one of these rate regimes. The cuts did not collapse the government's revenue as a share of the economy so much as they changed who pays and how — and, when they were not offset, they fed the deficits whose interest bill we track elsewhere.
So what did seventy years of cutting the top rate actually buy? Not the promised growth dividend — the postwar boom happened under 91 percent, not 37. What it tracks instead is the doubling of the top 1 percent's share of national income and a tax code that now taxes a wage at 37 percent and a capital gain at about 20 — while three-quarters of those gains flow to the very top. The ceiling came down. The question this page asks is who was standing underneath it.
The same investigation, restaged one beat at a time. Step through it here, or present it fullscreen.
The Ceiling Came Down.
The top tax rate was 91 percent through the Eisenhower boom. Today it is 37. A seventy-year project, pursued by both parties, sold every time as the key to growth — here is what it actually bought, and who it bought it for.
Seventy years, graded
The statutory top rate fell from 94% (1944) to 37% today — cut by more than half.
FACTThis is the documented spine. The highest marginal federal income-tax rate peaked at 94 percent in 1944–45, stayed above 90 percent through 1963 (91 percent for most of the Eisenhower years, 92 percent in 1952–53), then declined in steps: to 70 percent after the 1964 Kennedy–Johnson cut, to 50 percent under Reagan in 1982, to a low of 28 percent in 1988, back up to 39.6 percent under Clinton, and to 37 percent today. The source of record is the IRS Statistics of Income series, compiled by the Tax Policy Center. The chart below is that history in one line.
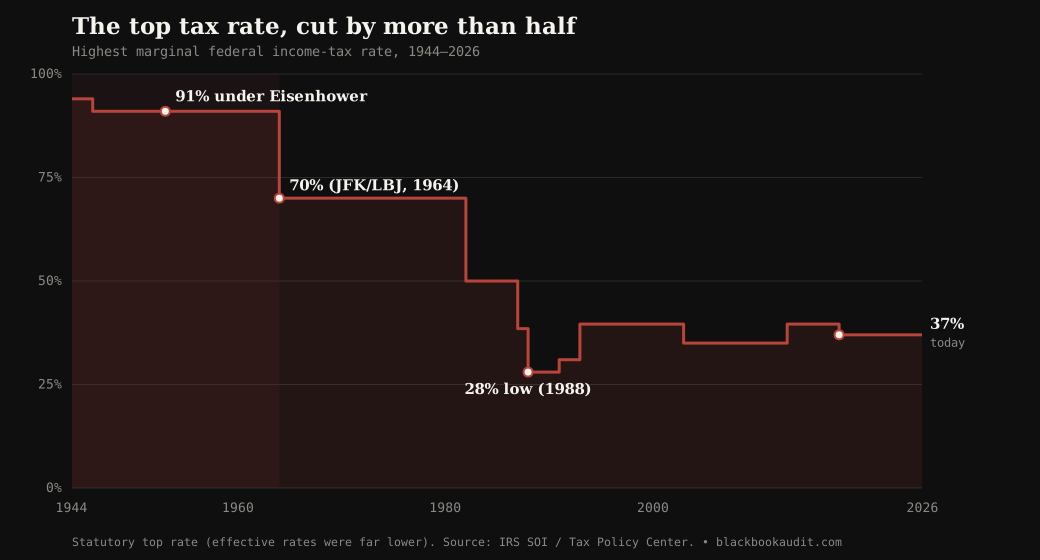
The 91% was never what the rich actually paid — effective rates were far lower.
FACTThe headline rate is routinely abused, so we fence it hard. The 91 percent applied only to income above a very high threshold (hundreds of thousands of dollars, millions in today's money), and the pre-1986 code was riddled with deductions and shelters. As a result, the top 1 percent's effective federal income-tax rate in the 1950s was near 17 percent, by the Tax Foundation's estimate; the Tax Policy Center, measuring the effective rate on income in the top brackets specifically, finds it ran about 49 percent between 1958 and 1981, versus roughly 35 percent under today's structure. Both can be true: almost no one paid anything close to 91 percent on their whole income, and the rich still paid materially more then than they do now. Anyone who quotes the 91 percent as what the wealthy handed over is wrong, and we won't.
Federal revenue held near 17% of GDP through every one of these rate regimes.
FACTThis is the fact that disciplines the whole debate, and it cuts against easy answers on both sides. Whether the top rate was 91 percent or 28, total federal revenue has hovered around 17 percent of GDP for the entire postwar period. That means two things at once. It means the right is wrong to claim high top rates would strangle the economy's capacity to be taxed — revenue didn't crater when rates were high. And it means the left is wrong to imagine that simply restoring a 91 percent headline rate would flood the Treasury — it wouldn't, because the money was always sheltered out of that bracket. The realistic revenue lever today is not the headline rate at all; it is the base — what counts as taxable income, how capital is treated, and whether the Bush and Trump cuts are reversed.
Every major cut was sold as self-financing growth — and the promised dividend didn't show up.
PROBABLY TRUEFrom Kennedy's advisers to Reagan's supply-siders to the authors of the 2017 cut, the pitch was constant: lower the top rate and the resulting growth will more than replace the lost revenue. The record does not support the strong version of that claim. The economy grew fastest, and most broadly, in the high-rate postwar decades; the deepest rate cuts were followed not by self-financing booms but by widening deficits, and official scorekeepers (the Joint Committee on Taxation, CBO) repeatedly found the cuts did not pay for themselves. We grade this PROBABLY TRUE rather than FACT because growth has many causes and no clean experiment isolates the tax rate — but the burden of proof sits on the promise, and seventy years in, it has not been met. We trace the mechanics in The Trickle-Down Myth.
As the top rate collapsed, the top 1%'s share of income more than doubled.
PROBABLY TRUEThe timing is hard to ignore. Over roughly the same decades that the top rate fell from 70 percent to the 30s, the top 1 percent's share of national income more than doubled in the United States — a shift documented by Thomas Piketty and Emmanuel Saez and confirmed in CBO's distributional work. We grade this a correlation, not a proven cause: globalization, technology, financialization, the decline of unions, and executive-pay norms all pushed the same direction, and a lower top rate is one force among several. But it is not a small or coincidental one — when the penalty for taking enormous pay falls, enormous pay becomes more worth taking. The cut didn't just lose revenue; it changed the incentives at the very top.
The real shelter is how the rich get paid: a wage is taxed at 37%, a capital gain at about 20%.
FACTThis is why the headline rate matters less than it looks. The top rate on ordinary income (wages, salary) is 37 percent; the top rate on long-term capital gains is 20 percent, plus a 3.8 percent net investment income tax — well below the wage rate. And capital gains are overwhelmingly a top-end form of income: an IRS Statistics of Income analysis finds that about 75.7 percent of capital gains flow to the top of the distribution, and CBO notes gains are 'generally taxed at lower rates than other income.' So the people with the most income increasingly receive it in the form the code taxes most lightly. Cutting or raising the top wage rate barely touches them; the gap between the wage rate and the capital-gains rate is the door the money actually walks through.
'Starve the beast': cutting revenue was, for part of the movement, the strategy — not a side effect.
FACTThe seventy-year slide was not only about letting people keep more of their money; for an influential strand of the conservative movement it was a deliberate fiscal strategy, stated out loud: cut taxes first, let the deficits build, and then use the deficits to argue that government must be cut. The phrase 'starve the beast' was used by the strategy's own advocates. We grade FACT that the strategy was openly articulated and pursued; whether any particular cut was motivated by it is case-by-case. But it reframes the whole history: the point was not always that the cuts would pay for themselves — sometimes the point was precisely that they wouldn't, so the resulting debt could force the spending cuts that could never win on their own. That is the engine behind The Interest Trap and the Deficit Hawks pattern.
How the most progressive tax code in American history was dismantled
The high-rate era was born of war. The top rate climbed into the 90s to finance World War II, and — this is the part that gets forgotten — it stayed there for two decades after the war ended, through Truman and all eight years of Eisenhower, a Republican general who made no move to cut it. That was the tax code under which the United States built the interstate highways, sent a generation to college on the GI Bill, and grew the largest middle class in its history, while paying down a national debt that had topped 100 percent of GDP. The high top rate was not a radical experiment; it was the settled, bipartisan normal of the American century's most prosperous years.
The unwinding began in 1964, when the Kennedy–Johnson tax cut brought the top rate from 91 to 70 percent — a Democratic cut, which matters, because the dismantling was never one party's project alone. But the decisive break was Ronald Reagan's. The 1981 Economic Recovery Tax Act cut the top rate from 70 to 50 percent, and the 1986 Tax Reform Act drove it all the way to 28 by 1988 — the lowest in seventy years. The promise each time was the supply-side one: the cuts would generate enough growth to pay for themselves. They did not. The deficits of the 1980s are the first chapter of the story we tell in The Interest Trap, and the growth-for-everyone promise is the one we test in The Trickle-Down Myth.
What followed was a ratchet. Clinton pushed the top rate back to 39.6 percent in 1993; the Bush cuts pulled it to 35; Obama restored 39.6 for the very top in 2013; the 2017 Trump cut set it at 37, where it sits. Each upward correction was smaller and more contested than the downward moves, and — crucially — the action increasingly moved away from the wage rate entirely. As the top rate on ordinary income bounced in the 30s and 40s, the rate on capital gains stayed far lower, and the wealthy's income shifted toward capital gains, carried interest, and other lightly taxed forms. The fight over the headline rate became, to a large degree, a fight over a number that the people with the most money had already arranged to avoid.
Through all of it, one number barely moved: federal revenue stayed near 17 percent of GDP. That is the quiet refutation of the loudest claim on both sides. The rate on the richest Americans fell by more than half, and the government did not collect a dramatically different share of the economy — because the headline rate was never where the real money was decided. What changed was not how much the government took in, but who carried the load, how the after-tax rewards at the top exploded, and how the unoffset cuts seeded the debt that is now used, through its interest bill, as the argument for cutting everything else. That is why this page lives in The Austerity Myth.
If revenue never changed, what was the point?
Here is the uncomfortable conclusion the numbers push toward. If federal revenue held near 17 percent of GDP whether the top rate was 91 percent or 28, then seventy years of cutting the top rate did not, on the whole, starve the government of revenue as a share of the economy. What it did was redistribute — upward. It let the after-tax income of the people at the very top rise far faster than everyone else's, it shifted the tax system toward lightly taxed capital and away from wages, and, where the cuts were not paid for, it converted public revenue into private wealth financed by public debt. The 91-percent era built a middle class. The 37-percent era built a billionaire class. That is not a slogan; it is what the income-share data show, and it is the thing the headline-rate fight is structured not to notice.
- If federal revenue stayed near 17 percent of GDP no matter the top rate, what did seventy years of cutting it actually accomplish — and for whom?
- A wage is taxed at 37 percent and a capital gain at about 20, and three-quarters of capital gains flow to the top. Is the tax code neutral about how you earn your money, or does it quietly reward owning over working?
- The most prosperous broad-based era in American history ran under a 91 percent top rate. If high rates are supposedly incompatible with prosperity, how did that happen — and why is the burden of proof always placed on raising rates rather than on the cuts that were promised to pay for themselves?
- Each cut was sold as temporary pain for future growth. When the growth didn't cover the cost and the debt rose instead, why was the answer always another cut, and never a reversal?
Questions worth taking seriously
So were 1950s taxes on the rich high or not?
Higher than today, but nowhere near the 91 percent headline. The statutory top rate was 91 percent, but it applied only to income above a very high threshold and the code was full of shelters, so the top 1 percent's effective income-tax rate was near 17 percent (Tax Foundation) and the effective rate on top-bracket income ran about 49 percent versus roughly 35 percent now (Tax Policy Center). So the rich did pay materially more than they do today — just not 91 percent. Both the “they paid 91 percent” claim and the “taxes on the rich were basically the same” claim are wrong; the truth sits in between, and we show both numbers.
If revenue stayed flat, doesn't that mean the top rate doesn't matter?
It matters — just not mainly as a revenue lever. Revenue as a share of GDP stayed near 17 percent because the headline rate was never where the real money was decided; shelters and the treatment of capital did the work. What the top rate changed was distribution: who bears the load, and how fast after-tax income at the very top can grow. So the honest case for a higher effective rate on the top isn't “it will flood the Treasury” — it's about inequality and about reversing specific unpaid-for cuts (Bush, Trump) that measurably lost revenue. We make that distinction on purpose, because the sloppy version (“just bring back 91 percent”) is easy to debunk and we won't hand anyone that gift.
If you are named on this page
If you are named on this page, or are a party materially affected by the claims made here, and you wish to respond, correct the record, or add context, use the Contact page. Responses are published verbatim alongside the original claim, with the sender identified and the date of receipt. The channel stays open for the life of the page.
This site aggregates and grades a record that other outlets and primary sources have already put on the record. Every FACT-graded claim above is sourced to court filings, government reports, sworn whistleblower disclosures, published investigative journalism, or named-source statements. The citations are the accountability mechanism; this section is how you get on the record too.
The record
- Tax Policy Center — Historical Highest Marginal Income Tax Rates (94% in 1944 to 37% today)
- Tax Policy Center — Top Income Tax Rates and Revenue (effective ~49% on top brackets 1958–81; revenue stable ~17% of GDP)
- Tax Foundation — Taxes on the Rich Were Not That Much Higher in the 1950s (top 1% effective income-tax rate ~17%)
- NBER / Alvaredo, Atkinson, Piketty, Saez — The Top 1 Percent in International and Historical Perspective (share more than doubled)
- CBO — The Distribution of Household Income, 2023 (top-end concentration; capital gains taxed below other income)
- IRS Statistics of Income — The Distribution of Capital Gains in the United States (75.7% flow to the top)
- Black Book Audit — The Interest Trap (the deficit and interest the cuts built)
- Black Book Audit — The Trickle-Down Myth (the growth promise, tested)
- Black Book Audit — The Austerity Myth